트레이딩 포스트 — 2026년 5월 6일 (수)
Trading Post Wednesday May 6, 2026
원문 보기 (영문) →오늘 NASDAQ 100이 500포인트 넘게 오르며 또 다시 사상 최고가를 경신했다. 그에 앞서 BTIG의 조나단 크린스키가 다음 차트를 공유했다.
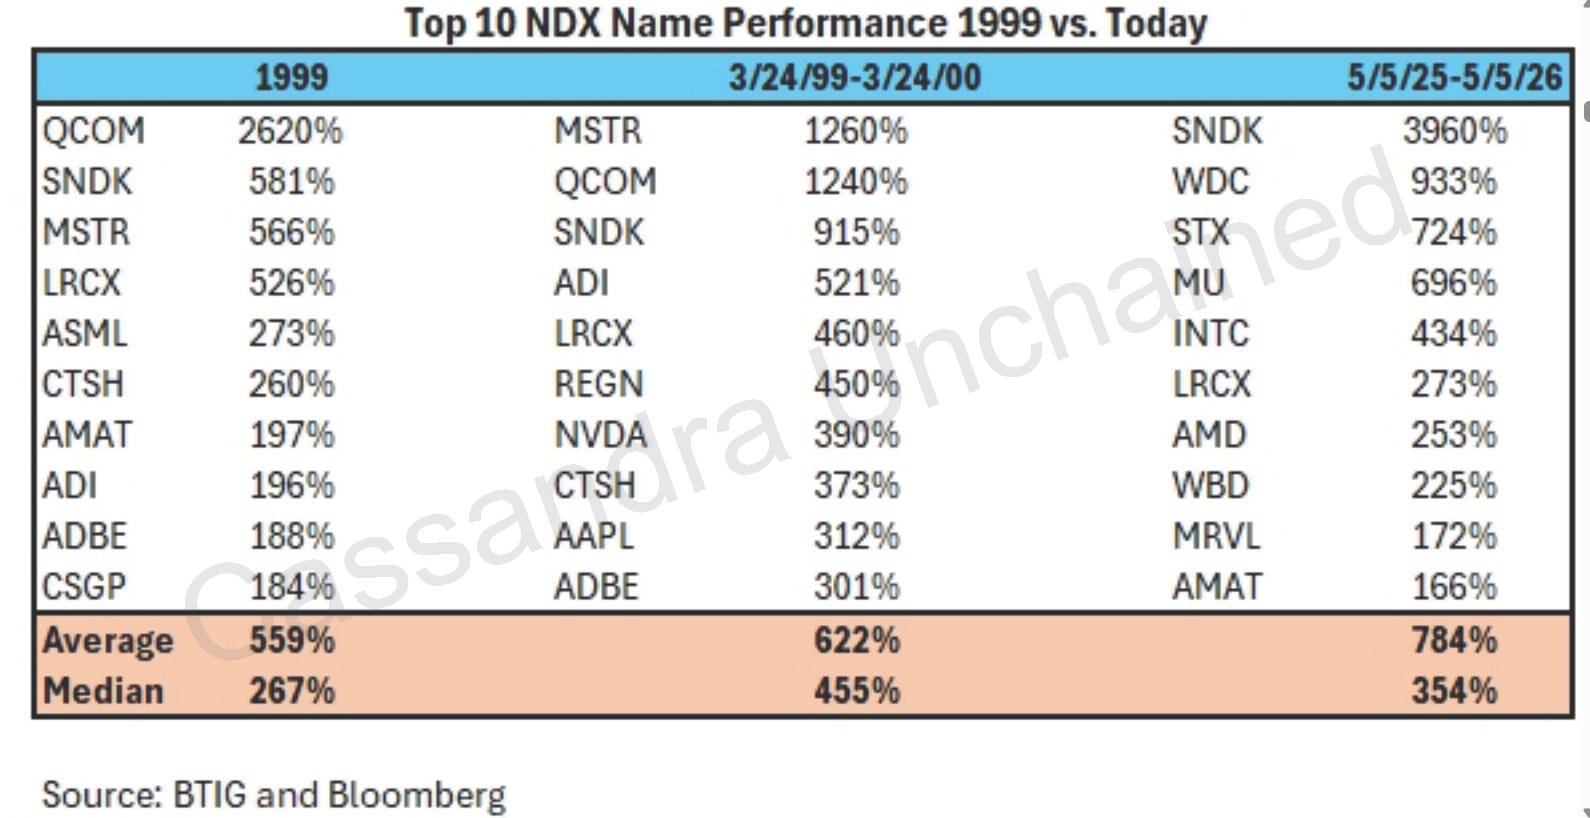
크린스키에 따르면, 1999년 NDX 상위 10개 종목의 평균 상승률은 +559%였다. 2000년 3월 24일 직전 1년 동안 NDX 상위 10개의 평균 상승률은 +622%였다. 그런데 지난 1년간 NDX 상위 10개 종목의 평균 상승률은 +784%로, 닷컴 두 시기 모두를 넘어섰다. 중위값(median)은 +354%로 닷컴 정점 직전의 +455%보다는 낮지만, 1999년의 중위값 +267%보다 훨씬 높다.
나는 필라델피아 반도체 지수(SOX)의 역사적 추이를 다시 살펴봤다. 아래에서 흰색은 1996년부터 2000년 3월 정점까지의 지수, 노란색은 같은 기간 동안 오늘까지의 지수다. 두 그래프 모두 1996년 시점을 100으로 정규화했다.
The NASDAQ 100 was up over 500 points today to another all-time high, and before that, Jonathan Krinsky with BTIG posted this chart.
Per Jonathan:
If we look at the top 10 performing NDX stocks in 1999, they were up an average of 559%. The top 10 in the year leading up to 3/24/00 were up an average of 622%. The top 10 NDX names over the last year are up an average of 784%, beating both the dot-com periods. The median gain is still 354%, which is less than the 455% into dot-com peak, but well above the ‘99 median of 267%.
I took a historical look at the Philadelphia Semiconductor Index. Below, white the Index from 1996 through the top in March 2000. Yellow is the same index over the same duration period through to today. Both graphs are normalized to start at a value of 100 in 1996.