Schrödinger’s Market
원문 보기 (영문) →한국어 번역이 곧 추가됩니다. 그 동안 아래 영문 원문 또는 출처 사이트를 참고해주세요.

“If a man never contradicts himself, the reason must be that he virtually never says anything at all.”
-Erwin Schrödinger
Key Takeaways
Markets are pricing a split reality: energy fundamentals remained constrained despite sector underperformance, while momentum and leverage continued to fuel a powerful rally in memory stocks, in our view
Energy’s tight inventories, record refining margins, and persistent transportation disruptions supported durable cash returns for producers
Select hyperscalers and semiconductors now offer more compelling AI exposure after valuation resets, in our view, while leveraged memory stocks and closed-source model providers face growing sustainability and competitive risks
We do not often write about quantum mechanics, and we will not spend a ton of time on it, but often analogies can be quite helpful in making a point.
Erwin Schrödinger created his famous “Schrödinger’s Cat” thought experiment to illustrate the absurdities of applying quantum mechanics to everyday objects. The idea is that until you look into the box, the cat was suspended across two simultaneously opposed states: one alive and one not so.
Similarly, we think today’s markets are suspended in two similar states: one of simultaneous belief and disbelief. A belief that some trends can go on forever, say a rise in the price of memory stocks, or that some trends simply do not matter, say damaged energy infrastructure and their subsequent bottlenecks.
THE MARKET’S SUPERPOSITION
If we compare and contrast 1Q 2026 with 2Q 2026, those states could not be more diametrically opposed. Most sectors declined in 1Q, with energy being one of the few positive standouts. However, during 2Q, we saw the inverse. In fact, despite what is arguably the largest energy supply shock of our lifetimes, the energy complex—and by extension, energy producers—all underperformed. It seems very difficult that both of these things can be true simultaneously. Yet here we are.
There is no getting around our performance. We are not in the business of making excuses, but rather, giving context. For those of you who have been around for a while, we never take underperformance lightly. For those of you who have joined us more recently, I can assure you that remains the case.
Over my more than 30-year career, I have found plenty of ways of underperforming. This current period is no different. One of the key tenets of GQG is alignment, and we are invested alongside our clients, thus experiencing the ups and inevitable downs at the same time. Alignment, to us, is key to everything we do, but it also becomes even more important across these time periods of underperformance because we believe alignment breeds trust.
As we sit here roughly halfway through 2026, we are at a conflicting crossroads: one where the market has not seemed to care much (energy) versus an area where generally it has cared a lot (technology, and specifically memory). Maybe the catalyst for our current Schrödinger’s market is not looking at the cat, but rather, leverage.
ENERGY: AN ATTRACTIVE CAN KICK
Over the last 90 days or so, we have been surprised by the magnitude of the overall price declines across the energy sector. Part of this has been due to the decline in Chinese imports1 and part of this has been due to the US reducing its Strategic Petroleum Reserves (SPR) down to early 1980s levels.2 Regardless, we are running into a situation where inventories are declining across the board on a global basis. To us, these things cannot go on forever.
Our views were never predicated on a massive increase in the price of oil. Instead, our energy exposure has consistently been based on Brent crude trading between $65 and $80 per barrel, a range we view as the sweet spot for oil production. It stays out of the crosshairs of political backlash, while simultaneously staying below levels where shale producers would likely meaningfully ratchet up production.
But one area where we are seeing an incredible rise is in crack spreads, which are basically a proxy for overall refining profitability. Crack spreads measure how profitable it is to take three barrels of oil and break them down into a usable product, such as two barrels of gasoline equivalent and one barrel of distillate.
If we look at a chart of the standard 3-2-1 crack spread, it recently surpassed the 2022 highs and is now sitting at nearly $70 per barrel, an all-time high. All of this is happening despite the fact that crude oil benchmarks Brent and WTI are in the $80s per barrel as of July 2026. Rising spreads tend to be a net positive to the underlying price of oil.
On Tight Supply, Refining Margins Flying High
Therefore, with this type of backdrop, we have a situation where a company like Exxon is likely to drive solid returns, consisting of dividends, buybacks and organic EPS growth in the ballpark of high double digits, in our view.3
Not only that, we continue to question how quickly the normalization of the Strait of Hormuz will occur, especially in light of refiner Valero noting on their most recent earnings call that it takes roughly 3 days for every 1 day the strait is closed. At this rate (July 2026) that puts us about a year out. Not only that, but we are continuing to see tanker rates elevated while also having little clarity on how many ships will re-enter the strait after being stranded in the strait for so long.
TECH: LEVERAGE, CAPEX, AND KARP’S CONQUEST?
To continue our contradiction, it made little sense to us that a massive energy supply shock could be net positive for the broader technology complex. Yet these companies continued to exhibit upward price action. We see several risks in the tech space despite the price rise, but we have also recently identified a few potential opportunities.
What Goes Up (On Leverage), Must Come Down
On the risk side, we remain skeptical of the memory complex, and we believe the risk is most concentrated within emerging markets.
Because of this meteoric rise, maybe it is not that surprising that many South Koreans reportedly cashed out their life insurance policies4 while borrowing the most money on margin in the country’s history to ride this wave.5
Many investors are sanguine that the party will continue. The SK Hynix 2x leveraged fund recently became the largest leveraged single-stock ETF globally, surpassing the $10B mark and blowing past its other memory brethren.
The Market Has Become Jittery with Memory
There is no doubt the run-up here has been spectacular and given our views on the lack of sustainability across the space, it has been a frustrating drag on our relative performance. However, in our view, layering leverage on leverage in a cyclical market has historically not ended well, especially when relative volatility is also accelerating to the upside.
On the flip side of things, maybe the hyperscaler complex could be a much better bet.
Over the past six to 12 months, many high-quality technology companies, notably, hyperscalers and select semiconductor companies have de-rated on fears that these businesses are exhibiting higher capital intensity going forward (a characteristic markets have generally penalized). However, as our view on enterprise AI spending as a driver of more sustainable demand has improved, we now believe valuations of select companies have become more compelling and now reflect some of our broader views and concerns about AI.
The key change, for us, is not that AI risks have disappeared within these businesses but that fundamentals have remained better than we expected, while valuations have meaningfully reset. In some cases, such as with Amazon, Nvidia, and Microsoft, valuations are now lower than before AI took off in early 2023. To us, this is equivalent to investing in the core businesses we like at a reasonable price, with AI now becoming an interesting call option, in our opinion.
At a time when growth is strong and margins are generally improving, we think the decline in stock prices and subsequent stock underperformance, specifically across the hyperscalers, makes the current setup quite compelling. Memory stocks are more likely to be overearning while semiconductor names like Nvidia are less likely, in our view. As always, we keep an open mind to go back and own some of the names we owned not that long ago.
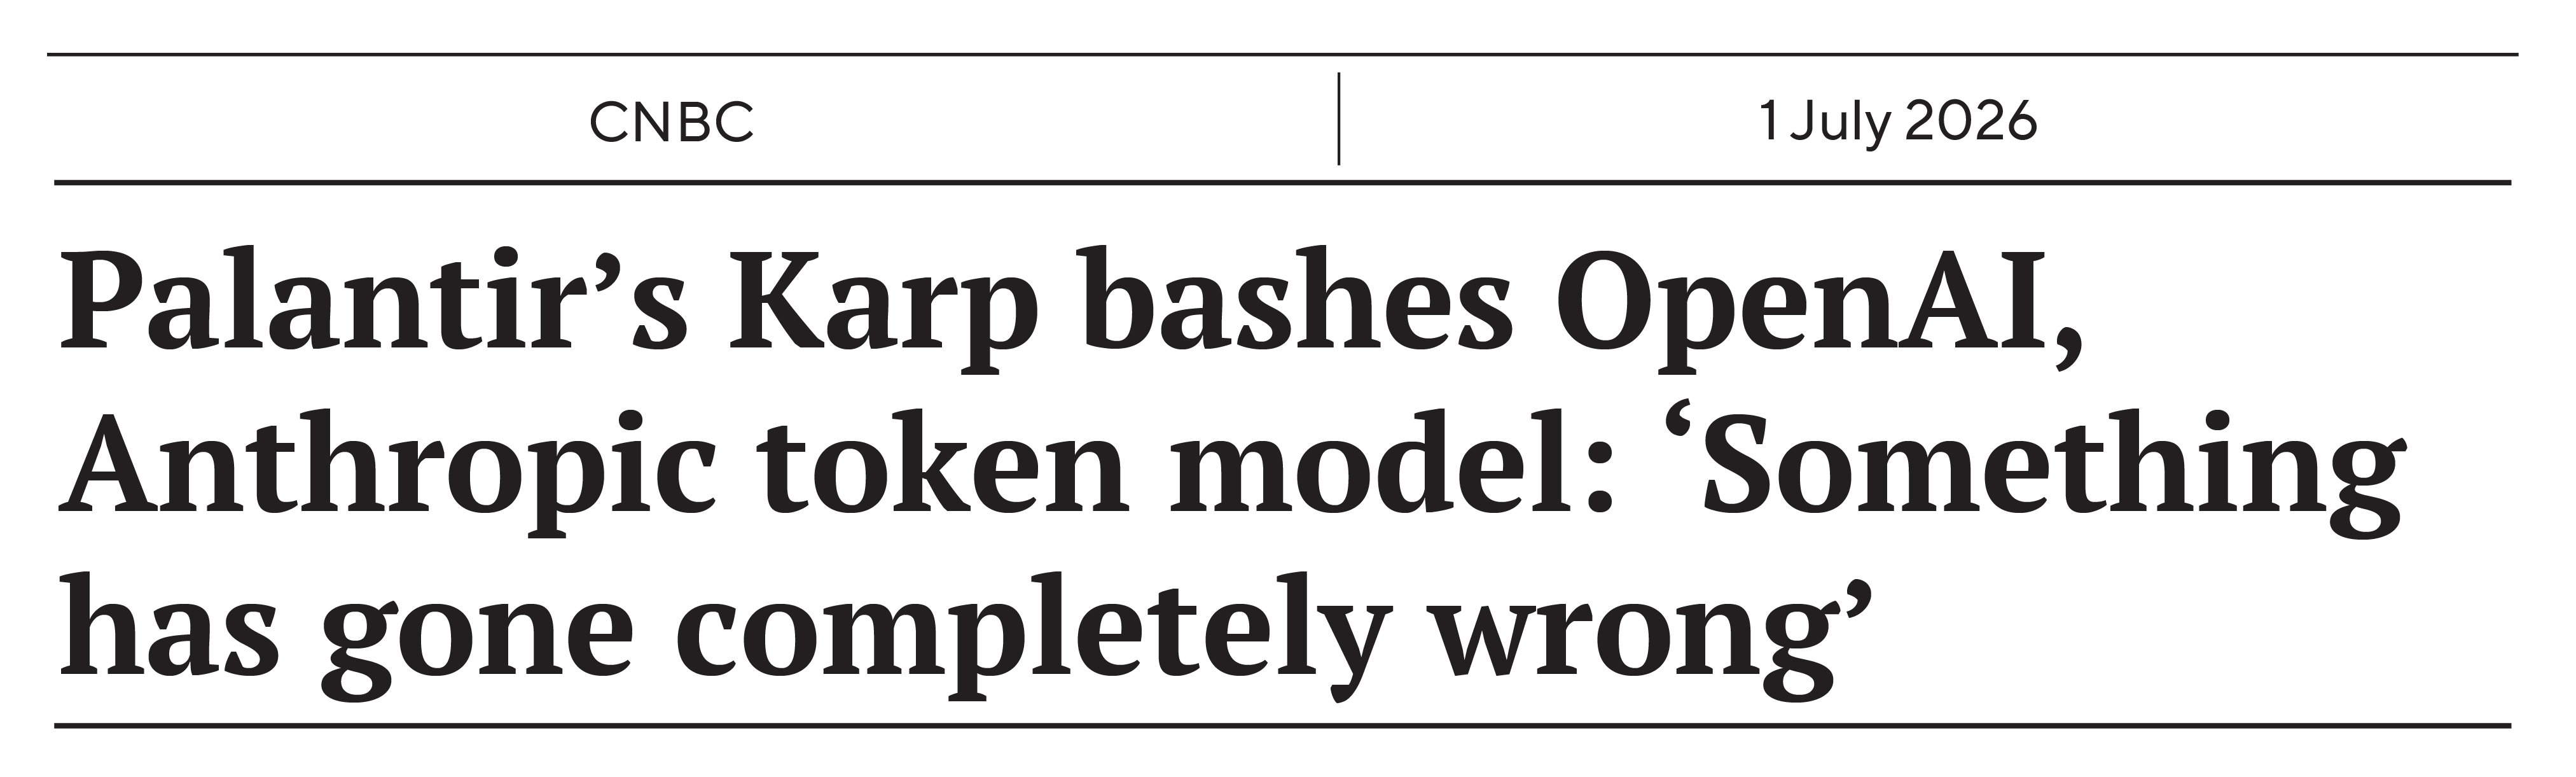
Lastly, for additional signs of cracks in the AI dam, further driving our contradiction, even one of the poster children of the AI buildout, Alex Karp of Palantir, has some harsh words for the frontier model providers.6
With more and more competition from open-source models, particularly those in China, we think the closed-source models could be in a very unenviable position going forward. We see the possibility for closed-source models losing market share and pricing power, while the overall system grows due to enterprise adoption. While this may seem like a net negative because many market participants associate OpenAI and Anthropic with everything “AI”, this may be a net positive for the environment as businesses gravitate toward cheaper models while increasing their overall usage.
When we roll these things up, it may seem like a contradiction and like we are also holding two incompatible things simultaneously: energy versus technology, technology versus technology, etc.
But at the end of the day, we must grapple with the markets we are presented with, not the ones we want. And in our minds, it is better to seem like a contradiction than do nothing at all.
As always, thank you for your support.
Rajiv Jain
Chairman & Chief Investment Officer
GQG Partners LLC
| Net of Fee Total Return Performance as of 30 June 2026 (Percent) | 3 Months | 1 Year | 3 Years | 5 Years | 10 Years | Since Inception* |
| Emerging Markets Equity Composite | 2.50 | 8.16 | 11.48 | 3.32 | 8.77 | 6.70 |
| MSCI Emerging Markets (Net) Index | 24.05 | 43.51 | 23.03 | 7.20 | 10.07 | 7.27 |
| Difference | -21.55 | -35.35 | -11.55 | -3.88 | -1.30 | -0.57 |
| Global Equity Composite | -2.47 | 3.65 | 11.99 | 8.49 | 12.88 | 11.64 |
| MSCI ACWI (Net) Index | 14.93 | 23.67 | 19.70 | 10.98 | 12.78 | 10.71 |
| Difference | -17.40 | -20.02 | -7.71 | -2.50 | 0.10 | 0.93 |
| International Equity Composite | 0.86 | 9.59 | 14.04 | 8.09 | 12.05 | 10.27 |
| MSCI ACWI ex USA (Net) Index | 14.49 | 27.66 | 18.82 | 8.79 | 9.93 | 7.53 |
| Difference | -13.63 | -18.07 | -4.78 | -0.70 | 2.12 | 2.74 |
| US Equity Composite | -5.41 | 0.55 | 11.42 | 8.96 | 15.08 | 13.54 |
| S&P 500 | 15.20 | 22.32 | 20.61 | 13.41 | 15.51 | 13.81 |
| Difference | -20.61 | -21.77 | -9.19 | -4.44 | -0.42 | -0.27 |
GQG Partners LLC claims compliance with the Global Investment Performance Standards (GIPS®) and has prepared and presented this performance information in compliance with the GIPS standards. GIPS® is a registered trademark of CFA Institute. CFA Institute does not endorse or promote this organization, nor does it warrant the accuracy or quality of the content contained herein. GIPS composite reports may be obtained by emailing clientservices@gqg.com.
Performance data is based on the firm’s composites for each strategy. The composites were created in June 2016. Performance presented prior to 1 June 2016 was achieved prior to the creation of the firm. The prior track record has been reviewed by Ashland Partners & Company, LLP and conforms to the portability requirements of the GIPS standards. On 28 June 2017, ACA Performance Services, LLC acquired the investment performance service business of Ashland Partners & Company, LLP. For periods after 1 June 2016, the composites consist of accounts managed by GQG pursuant to the strategy.
The US dollar is the currency used to express performance. Returns are presented net of management fees and include the reinvestment of all income. Prior to 1 April 2017, Net performance was calculated after the deduction of actual trading expenses and other administrative fees (custody, legal, administration, audit and organization fees). Thereafter, Net performance does not reflect the deduction of these other administrative fees. Net performance is calculated using the highest/model rack rate fee and is net of applicable foreign withholding taxes. PAST PERFORMANCE MAY NOT BE INDICATIVE OF FUTURE RESULTS. Totals may not sum precisely due to rounding. Returns for periods greater than one year are annualized.
*The US Equity composite inception performance data is since 1 July 2014. The GQG Partners Global Equity inception performance data is since 1 October 2014. The GQG Partners International Equity and Emerging Markets Equity inception performance data is since 1 December 2014.
END NOTES
1“China’s Collapsing Crude Oil Imports to Fall Further in June.” Bloomberg News. 25 June 2026.
2“Oil stocks in US Strategic Petroleum Reserve fall by 5.5 million to lowest level since 1983.” Reuters. 29 June 2026.
3“Investor Presentation. ExxonMobil Company overview and investment case.” ExxonMobil. 20 February 2026.
4Ji-Won, Choi. “Policy surrender payouts rise as savings-bank deposits hit 4-year low.” Korea Herald. 11 May 2026.
5Rimmer, Jules. “Debt-fueled bets are turbocharging the South Korean stock market as Kospi jumps 8%.” Morningstar. 21 May 2026.
6Subin, Samantha. “Palantir’s Karp bashes OpenAI, Anthropic token model: ‘Something has gone completely wrong.’” CNBC. 1 July 2026.
DEFINITIONS
Earnings Per Share (EPS): A company’s total net profit divided by the number of shares outstanding. It tells investors how much profit is attributable to each share they own. Higher and growing EPS is generally a positive sign for shareholders.
IMPORTANT INFORMATION
This webpage may be distributed by GQG Partners LLC and its affiliates (collectively “GQG”).
The information provided on this website does not constitute investment advice and no investment decision should be made based on it. Neither the information contained in this document or in any accompanying oral presentation is a recommendation to follow any strategy or allocation. In addition, neither is it a recommendation, offer or solicitation to (i) sell or buy any security, (ii) purchase shares in any investment fund that GQG may sponsor, offer or manage, (iii) establish any separately managed account, or (iv) implement any investment advice. It should not be assumed that any investments made or recommended by GQG in the future will be profitable or will equal the performance of any securities discussed herein. Before making any investment decision, you should seek expert, professional advice, including tax advice, and obtain information regarding the legal, fiscal, regulatory and foreign currency requirements for any investment according to the law of your home country, place of residence or current abode.
This webpage reflects the views of GQG as at a particular time. GQG’s views may change without notice. Any forward-looking statements or forecasts are based on assumptions and actual results may vary.
GQG provides this information for informational purposes only. GQG has gathered the information in good faith from sources it believes to be reliable, including its own resources and third parties. However, GQG does not represent or warrant that any information, including, without limitation, any past performance results and any third-party information provided, is accurate, reliable, or complete, and it should not be relied upon as such. GQG has not independently verified any information used or presented that is derived from third parties, which is subject to change. Information on holdings, allocations, and other characteristics is for illustrative purposes only and may not be representative of current or future investments or allocations.
The information contained on this website is unaudited. It is published for the assistance of recipients but is not to be relied upon as authoritative and is not to be substituted for the exercise of one’s own judgment. GQG is not required to update the information contained in these materials, unless otherwise required by applicable law. No portion of this document and/or its attachments may be reproduced, quoted or distributed without the prior written consent of GQG.
Past performance may not be indicative of future results. Performance may vary substantially from year to year or even from month to month. The value of investments can go down as well as up. Future performance may be lower or higher than the performance presented and may include the possibility of loss of principal. It should not be assumed that investments made in the future will be profitable or will equal the performance of securities listed herein.
Any account or fund advised by GQG involves significant risks and is appropriate only for those persons who can bear the economic risk of the complete loss of their investment. There is no assurance that any account or fund will achieve its investment objectives. Accounts and funds are subject to price volatility and the value of a portfolio will change as the prices of investments go up or down. Before investing in a strategy, you should consider the risks of the strategy as well as whether the strategy is appropriate based upon your investment objectives and risk tolerance.
There may be additional risks associated with international and emerging markets investing involving foreign, economic, political, monetary, and/or legal factors. International investing is not for everyone. You can lose money by investing in securities.
GQG Partners LLC is a wholly owned subsidiary of GQG Partners Inc., a Delaware corporation that is listed on the Australian Securities Exchange (ASX: GQG). GQG Partners LLC and its affiliates provide certain services to each other.
GQG Partners LLC is registered as an investment adviser with the US Securities and Exchange Commission. Please see its Form ADV Part 2, which is available upon request, for more information.
INFORMATION ON BENCHMARKS
The MSCI All Country World Index (MSCI ACWI) captures large and mid cap representation across 23 Developed Markets (DM) and 24 Emerging Markets (EM) countries.
The MSCI All Country World ex USA Index (MSCI ACWI ex USA) captures large and mid cap representation across 22 of 23 Developed Markets (DM) countries (excluding the US) and 24 Emerging Markets (EM) countries.
The MSCI Emerging Markets Index captures large and mid cap representation across 24 Emerging Markets (EM) countries.
The S&P 500® Index is a widely used stock market index that can serve as a barometer of US stock market performance, particularly with respect to larger capitalization stocks. It is a market-weighted index of stocks of 500 leading companies in leading industries and represents a significant portion of the market value of all stocks publicly traded in the United States.
You cannot invest directly in indices, which do not take into account trading commissions and costs.
NOTICE TO RECIPIENTS IN AUSTRALIA & NEW ZEALAND
The information in this document is issued and approved by GQG Partners LLC (“GQG”), a limited liability company and authorised representative of GQG Partners (Australia) Pty Ltd, ACN 626 132 572, AFSL number 515673. This information and our services may be provided to wholesale and retail clients (as defined in section 761G of the Corporations Act 2001 (Cth)) domiciled in Australia. This document contains general information only, does not contain any personal advice and does not take into account any prospective investor’s objectives, financial situation or needs. In New Zealand, any offer of a Fund is limited to ‘wholesale investors’ within the meaning of clause 3(2) of Schedule 1 of the Financial Markets Conduct Act 2013. This information is not intended to be distributed or passed on, directly or indirectly, to any other person.
NOTICE TO RECIPIENTS IN CANADA: Alberta, British Columbia, Manitoba, New Brunswick, Nova Scotia, Ontario, Québec, Saskatchewan (the “Canadian Jurisdictions” Only)
GQG Partners LLC relies on the (i) international adviser exemption pursuant to section 8.26 of NI 31-103 in each of the Canadian Jurisdictions, and (ii) non-resident investment fund manager exemption pursuant to section 4 of MI 32-102 in Ontario and Québec and is not registered as an adviser or investment fund manager in the Canadian Jurisdictions. This document has been prepared solely for information purposes and is not an offering memorandum or any other kind of an offer to buy or sell or a solicitation of an offer to buy or sell any security, instrument or investment product or to participate in any particular trading strategy. It is not intended and should not be taken as any form of advertising, recommendation, investment advice or invitation to trade. This information is confidential and for the use of the intended recipient only. The distribution of this document in Canada is restricted to recipients who are qualified “permitted clients” for purposes of National Instrument 31-103 Registration Requirements, Exemptions and Ongoing Registrant Obligations. This document may not be reproduced, redistributed or copied in whole or in part for any purpose without the prior written consent of GQG.
NOTICE TO RECIPIENTS IN THE UNITED KINGDOM
GQG Partners LLC is not an authorised person for the purposes of the Financial Services and Markets Act 2000 of the United Kingdom (“FSMA”) and the distribution of this document in the United Kingdom is restricted by law. Accordingly, this document is provided only for and is directed only at persons in the United Kingdom reasonably believed to be of a kind to whom such promotions may be communicated by a person who is not an authorised person under FSMA pursuant to the FSMA (Financial Promotion) Order 2005 (the “FPO”). Such persons include: (a) persons having professional experience in matters relating to investments; and (b) high net worth bodies corporate, partnerships, unincorporated associations, trusts, etc. falling within Article 49 of the FPO. The services provided by GQG Partners LLC and the investment opportunities described in this document are available only to such persons, and persons of any other description may not rely on the information in it. All, or most, of the rules made under the FSMA for the protection of retail clients will not apply, and compensation under the United Kingdom Financial Services Compensation Scheme will not be available.
GQG Partners (UK) Ltd. is a company registered in England and Wales, registered number 1175684. GQG Partners (UK) Ltd. is an appointed representative of Sapia Partners LLP, which is authorised and regulated by the Financial Conduct Authority (“FCA”) (550103).
NOTICE TO RECIPIENTS IN ADGM
GQG Partners Ltd, a company limited by shares, registered in Abu Dhabi Global Market (“ADGM”), having its address at Unit 12, 7th Floor, Al Khatem Tower, Al Maryah Island, Abu Dhabi, United Arab Emirates. GQG Partners Ltd is licensed by the ADGM’s Financial Services Regulatory Authority (FSRA) (license number 240015). GQG Partners Limited is licensed by the ADGM’s Financial Services Regulatory Authority (FSRA) to conduct the regulated activities of Managing a Collective Investment Fund, Advising on Investments or Credit, Arranging Deals in Investments, Managing Assets, Shari’a-compliant Regulated Activities. This document is intended for distribution only to persons of a type specified in the FSRA’s Rules (i.e., “Professional Clients”) and must not be delivered to or relied on by any other type of person. It is for the exclusive use of the persons to whom it is addressed and in connection with the subject matter contained therein. The FSRA, or any other regulatory authority, has no responsibility for reviewing or verifying this document or any other document in connection with it. Accordingly, the FSRA, or any other regulatory authority, neither approved this document or any other associated documents nor taken any steps to verify the information set out in this document and has no responsibility for it.
© 2026 GQG Partners LLC. All rights reserved. Data presented as at 30 June 2026 and denominated in US dollars (US$) unless otherwise indicated.
CIOPR 2Q26-CL
The post Schrödinger’s Market appeared first on GQG Partners.