Ethereum Posts Record 204M Base-Layer Transactions in Q1 — Yet ETH Trades 50% Below Its Peak
Ethereum processed 204 million base-layer transactions in Q1 2026, surpassing the 200 million mark for the first time in history. Yet ETH remains stuck more than 50% below its all-time high.

Key Takeaways
- Ethereum recorded 204 million base-layer transactions in Q1 2026, marking the first time the network has ever surpassed 200 million in a single quarter.
- Transaction volume surged 43% quarter-over-quarter from 145 million in Q4 2025, and is more than double the ~90 million per quarter seen during the 2023 trough.
- ETH is trading around $2,300, down more than 50% from its August 2025 all-time high of approximately $4,950.
- The migration of activity to L2s and the Dencun upgrade have reduced base-layer fee burn, weakening the supply-side narrative that supported previous rallies.
Ethereum just had its busiest quarter on record. The price, however, didn't get the memo.
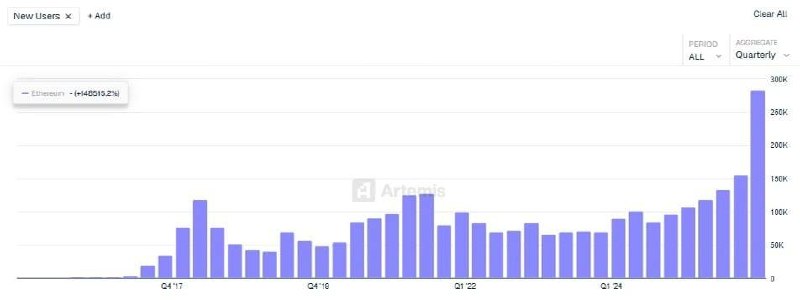
According to data from on-chain analytics platform Artemis, the Ethereum network processed 204 million base-layer transactions in Q1 2026 — the first time in history the network has crossed the 200 million threshold in a single quarter. That represents a 43% jump from the 145 million transactions recorded in Q4 2025, and more than double the roughly 90 million per quarter logged during the network's 2023 slump.
Quarterly transaction volume bottomed out in late 2023, then traded sideways between 100 million and 120 million throughout 2024. A clear recovery trend emerged in mid-2025, with the network setting new quarterly records in successive periods before culminating in this quarter's peak. Analysts are characterizing the trajectory as a completed U-shaped recovery.
Why Isn't the Price Following?
Despite the bullish fundamental backdrop, ETH was trading at approximately $2,328 as of Friday, April 18 — more than 50% below the all-time high of roughly $4,950 set in August 2025. The token shed 32.8% in Q1 alone.
Paradoxically, this disconnect stems in part from Ethereum's own scalability success. The Dencun upgrade, implemented in 2024, dramatically reduced data storage costs for Layer 2 networks. While L2 activity subsequently exploded, the amount of ETH burned through base-layer fees actually declined. The network quietly shifted back into a net inflationary state, eroding the supply-side narrative that had underpinned previous bull runs.
Elevated NVT (Network Value to Transactions) ratios suggest that market capitalization continues to outpace the actual economic value settled on-chain. In other words, rising transaction counts are not cleanly translating into value accrual for token holders.
Two Structural Drivers: L2s and Stablecoins
Two structural forces are behind the surge in transaction volume.
The first is the Layer 2 ecosystem. Led by Base and Arbitrum, L2 solutions now account for approximately 95% of total throughput across the Ethereum ecosystem. Users execute transactions on L2s at lower fees, and the resulting settlements and bridge transactions are recorded on Ethereum's base layer — directly inflating the headline transaction count.
The second driver is stablecoins. According to Token Terminal, total stablecoin supply on the Ethereum network reached an all-time high of $180 billion in early April — a 150% increase over the past three years, representing approximately 60% of the global stablecoin market. Tether (USDT) and Circle (USDC) dominate supply, reinforcing Ethereum's position as the primary settlement layer for tokenized dollars.
New user onboarding also flashed recovery signals. New users in Q1 came in at 284,000, up 82% quarter-over-quarter, while active addresses reached 12.6 million.
Q2 Will Be the Real Test
The ETH/BTC ratio has bounced recently, recovering to around 0.0313 — a three-month high, though still well below January's peak of 0.038. Analysts argue that a reclaim of the 0.035 level on a weekly closing basis would be needed to confirm a structural rotation into ETH rather than a simple short squeeze.
Exchange ETH reserves are trending lower, with on-chain data suggesting holders are moving tokens into self-custody. This is broadly interpreted as a signal of constrained near-term sell-side pressure.
Ultimately, two questions will determine whether this milestone translates into price support. First, can the 200 million transaction run-rate be sustained through Q2? Second, does this growth reflect genuine new user onboarding, or is it largely bot-driven stablecoin transfers? Only when both conditions are met will this record transaction milestone carry meaningful weight as a bullish price catalyst.
This content is for informational purposes only and does not constitute investment advice.
 ETH
ETHFrequently Asked Questions
거래량 2억 건인데 ETH 가격이 안 오르는 이유는?
덴쿤 업그레이드로 L2 데이터 저장 비용이 크게 낮아져 L2 활동이 폭발적으로 늘었지만, 기본 레이어 수수료 소각 ETH 양은 오히려 줄었습니다. 네트워크가 인플레이션 상태로 전환되며 이전 랠리를 뒷받침했던 공급 측 내러티브가 약화됐습니다. 높은 NVT 비율이 시가총액 vs 실제 거래 가치 괴리를 보여줍니다.
이더리움 거래량을 이끄는 두 축은?
첫째, 베이스·아비트럼 중심 L2 솔루션이 이더리움 처리량의 약 95%를 담당합니다. 둘째, 1,800억 달러 규모 스테이블코인 공급(글로벌 시장 60%)이 USDT·USDC 중심으로 토큰화 달러 기축 정산 네트워크 지위를 강화하고 있습니다.
신규 사용자 유입은 회복되고 있나요?
1분기 신규 사용자 28만 4천 명으로 전 분기 대비 82% 증가했고 활성 주소는 1,260만 개입니다. 다만 이 성장이 봇 기반 스테이블코인 송금이 아닌 실질 신규 사용자 온보딩을 반영하는지가 중요한 질문으로 남아 있습니다.
ETH 가격 회복의 트리거는 무엇인가요?
ETH/BTC 비율이 0.0313에서 주간 종가 기준 0.035 구간을 탈환하면 단순 숏 스퀴즈를 넘어선 구조적 로테이션 신호로 볼 수 있습니다. 거래소 ETH 보유량 감소(매도 압력 약화)와 2분기 거래량 2억 건 유지 + 실질 사용자 온보딩 확인이 가격 지지력으로의 전환 조건입니다.


Bitwise's Jeff Park: Crypto Is 'NVIDIA Before the AI Boom' — Most Bullish Phase Ever

Harvard Endowment Trims Bitcoin ETF 43%, Dumps Ethereum ETF After One Quarter — $97M in Realized Losses

Italy's Largest Bank Intesa Sanpaolo Added Ethereum and XRP for the First Time in Q1, Doubling Crypto Portfolio to $235M
Wall Street's Defining Moments
See more


Smart Money Briefing
Weekly summaries of Wall Street guru moves and crypto whale activity.