SOX P/E hits 60×, 16% above its 50-day moving average — Wall Street splits between "AI super-cycle" and "bubble"
The Philadelphia Semiconductor Index (SOX) has surged 41% over the past four weeks. There hasn't been a four-week run that fast since the 2000 dot-com bubble peak. The 30% gain over 13 trading sessions is the largest stretch since 2002.
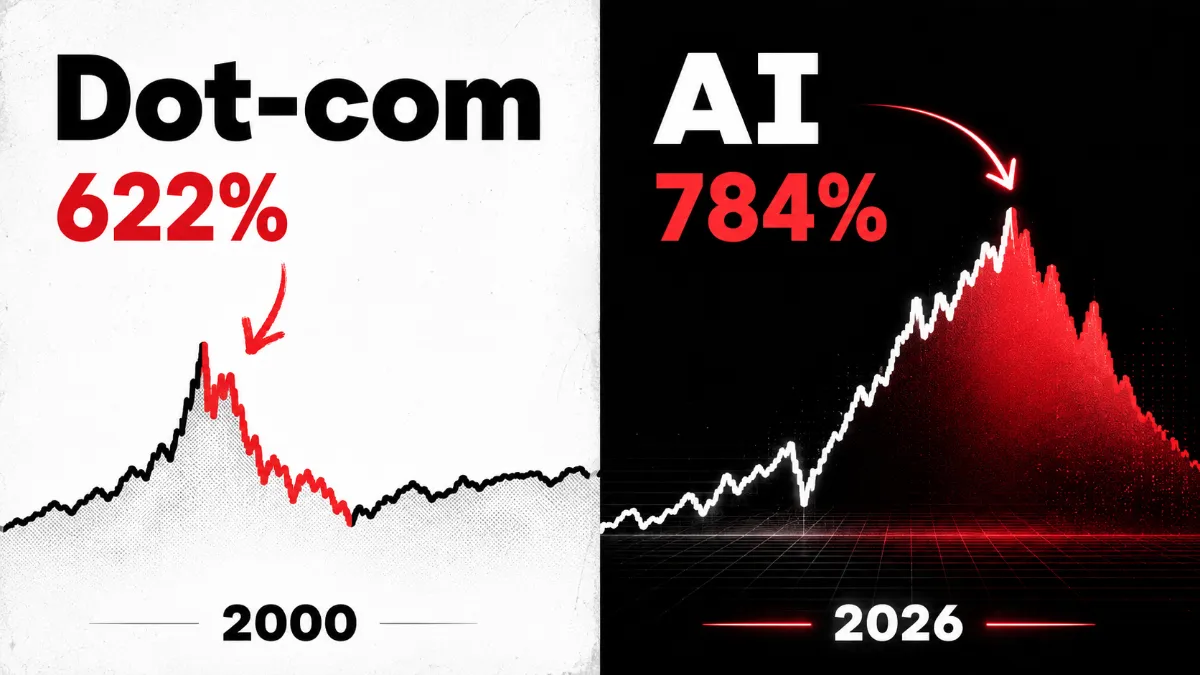
On the numbers alone, this is exciting. But the fact that those exact numbers overlap with the dot-com peak is splitting Wall Street — between "this is different because AI is real" and "the speed is too much."
How Far Have We Gotten vs. the Dot-Com Bubble?
SOX is currently more than 16% above its 50-day moving average. BTIG chief chart strategist Jonathan Krinsky notes that, after this signal triggers, the index has fallen five trading days later 85% of the time, with a median return of -3.64%. The last instance of this signal firing while SOX was breaking new highs? March 2000 — the dot-com peak.
The semiconductor sector's current P/E is around 60×, the highest reading since the dot-com era. The Nasdaq is closing in on 25,000 in 2026, and some technical analysts point out that 25,000 is exactly 5× the dot-com peak of 5,000 — a 25-year cycle aligning with a 5× multiple at the same point.
But Here's What's Different from the Dot-Com Bubble
The differences are also clear. In the dot-com bubble, companies without earnings rallied. Today, the companies rallying are making money.
- TSMC: Q1 revenue +35% YoY, breaking NT$1 trillion (~$35.6B) for the first time in history
- Micron: Up 11% on a Fitch credit rating upgrade — record high
- SanDisk: Gross margin near 80%, Q3 revenue growth +97%
- Nvidia: Forward P/E around 23× — actually lower than the peer average of 49×
Wedbush's Dan Ives put it this way:
There are no cracks anywhere in AI demand — chips, hardware, or software. Heading into Q1 earnings season, the case for owning core tech winners is a bright green light.
Dan Ives, Senior Analyst at Wedbush
The "It's a Bubble" Camp
The bear case isn't simple either. Since the Iran war began on February 28, SOX has climbed 24% through April 28. The conventional view that war-driven geopolitical uncertainty would weigh on equities was completely wrong. The debate is whether AI demand is genuinely stronger than war risk, or whether the market is underpricing the risk.
A National Bureau of Economic Research (NBER) study published in February 2026 found that 90% of surveyed companies said AI had no material productivity impact. Executives, in contrast, projected AI would lift productivity by 1.4%. The gap between reality and expectations is the critique.
OpenAI has committed $1.4 trillion in data-center spending over eight years, against current annual revenue of just $13 billion. The fact that this long-term spend is being funded with debt is another concern.
How to Read It Technically
That the SOX four-week rally is parabolic is obvious from the chart. However, SOX's large unfilled gap sits below at 8,004 — more than 20% below the current level (10,514). To fill that gap, the index would need to drop more than 20%.
Per OANDA's technical read, SOX's current momentum is still below dot-com extremes and bearish divergences haven't shown up yet. The Nasdaq 100's percentage of names above their 50-day moving average sits at 54% — above the 50% threshold — suggesting overall market health is intact.