Buffett Indicator Breaks 227%… "Not Bull Market but Danger Zone, Berkshire Piling Up Cash"
Warren Buffett's most trusted valuation indicator has significantly exceeded the level he himself designated as a 'danger zone.' The Buffett Indicator currently stands at 227%, surpassing by 27 percentage points the 200% threshold he warned constitutes 'playing with fire.' S&P 500 forward P/E of 28x, corporate profits at 12% of GDP, and Berkshire's record cash position are simultaneously flashing warning signals.
- Buffett's market indicator hit 227%, surpassing his own 200% "danger zone" threshold
- S&P 500 trades at 28x forward P/E—65% above its 100-year average—as Berkshire holds near-record cash
Warren Buffett's most trusted valuation indicator has significantly exceeded the level he himself designated as a 'danger zone.' And Buffett isn't buying right now.
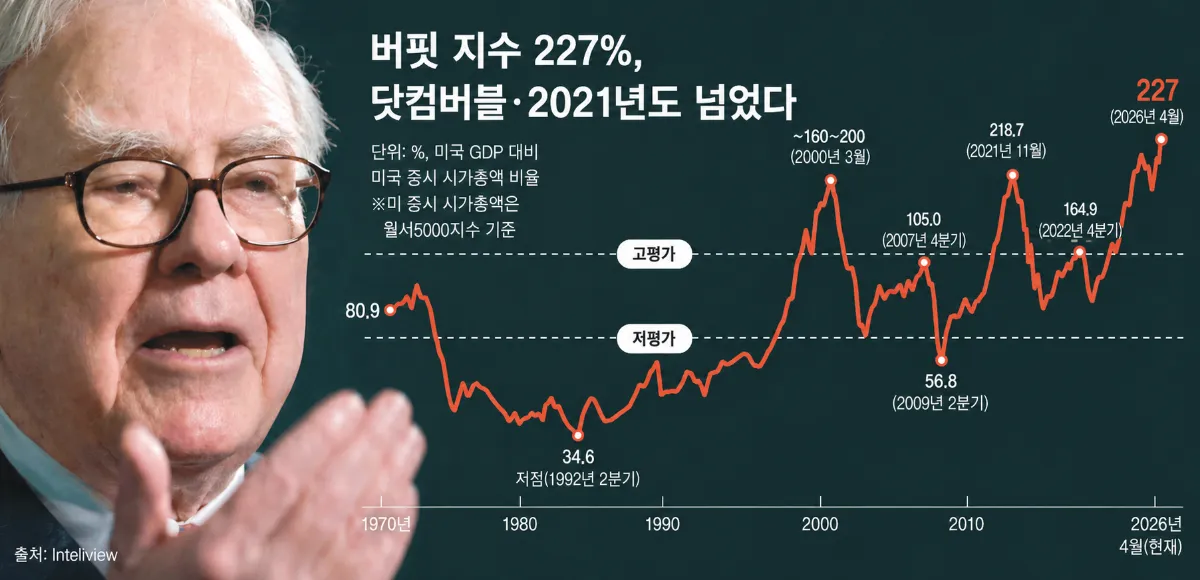
The Buffett Indicator, which divides the total U.S. stock market capitalization by GDP, currently stands at 227%. This exceeds by 27 percentage points the level Buffett warned about in his 2001 Fortune article, where he cautioned that approaching 200% would be 'playing with fire' rather than a bull market. The S&P 500 is near all-time highs at 7,165 points amid a rebound following Iran war aftermath.
Two Problems Accumulating Simultaneously
According to Fortune's analysis, the current situation goes beyond simple overvaluation, with two problems overlapping.
First is the excessive concentration of corporate profits. Corporate earnings now account for 12% of GDP, significantly above the historical average of 7-8%. Bulls argue this justifies high stock prices. However, as Milton Friedman pointed out, 'corporate profits as a percentage of GDP cannot remain significantly above historical averages for extended periods.' High margins attract competitors, and competition compresses margins again. The very profits investors are paying premiums for could be diluted by competition.
Second is valuation itself. The S&P 500's GAAP-based forward P/E exceeds 28x. While the commonly used non-GAAP (operating earnings) forward P/E is around 21-23x, both are historically quite high compared to the 100-year GAAP average of approximately 17x. This means investors are simultaneously paying higher prices for already elevated earnings.
What History Tells Us
The two previous instances when the Buffett Indicator reached 200% each left distinct outcomes. After reaching 200% at the dot-com bubble peak in March 2000, the S&P 500 fell approximately 50%. When it slightly exceeded 200% in November 2021, a correction of about 25% followed.
The current 227% is uncharted territory where this indicator has never been sustained. Buffett has always been clear: this indicator doesn't tell when a correction will come. It simply indicates that expected returns from current levels are much lower than the recent rally suggests.
Berkshire's Cash Is an Even Stronger Signal
A stronger signal than the numbers is Buffett's behavior. Berkshire Hathaway has sold more stocks than it bought for several consecutive quarters. As of January 2026, its cash position stands at approximately $382 billion, a record high. Buffett has always deployed capital when he discovered real value. The fact that he's not buying now means he's not finding sufficiently attractive opportunities at current prices.
What the Buffett Indicator is saying mathematically, Buffett himself is saying through his actions.
Related Stocks & ETFs
Hedge/Defensive positions: GLD, TLT, BND, VTV (value stocks)
Frequently Asked Questions
What is the Buffett Indicator?
The Buffett Indicator is the ratio of total U.S. stock market capitalization to GDP. Warren Buffett introduced it in a 2001 Fortune article, describing it as "probably the best single measure of where valuations stand at any given moment." A reading of 100% indicates that the market's size is in line with the overall economy.
How elevated is a reading of 227%?
It represents an all-time high, surpassing both the peak of the dot-com bubble (around 200%) and the 2021 high (which modestly exceeded 200%). It sits 27 percentage points above the 200% threshold that Buffett once warned was "playing with fire."
Should I sell my stocks right now?
Buffett himself does not use this indicator to time sell decisions. Markets can remain overvalued for extended periods. What the indicator does suggest is that expected returns at current levels are low and that the risk-reward balance is unfavorable.
How large is Berkshire Hathaway's cash position?
As of January 2026, Berkshire's cash holdings stood at approximately $382 billion, an all-time record. The company has been a net seller of equities for several consecutive quarters. Official details on portfolio changes during Q1 2026 will be available following Berkshire's quarterly earnings release, scheduled for May 2026.

3 Dividend Stocks to Reduce Market Crash Risk: Medtronic, Realty Income, ExxonMobil

Top High-Yield Dividend Stocks: Brookfield Infrastructure, Clearway Energy, Enterprise Products

Williams Companies: 227% in 5 Years, Beats Nasdaq-100 by 94 Points — AI Data Center Upside Next
Wall Street's Defining Moments
See more


Smart Money Briefing
Weekly summaries of Wall Street guru moves and crypto whale activity.