BofA: U.S. Economy Trapped in 'Nominal Boom Loop'... 30-Year Yield at 5% Is the Critical Threshold
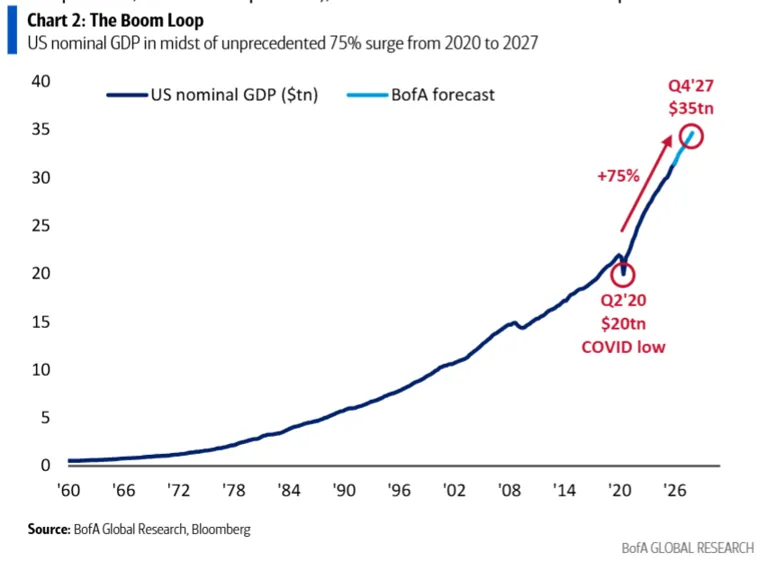
BofA's Hartnett identifies "nominal boom loop" dynamic. GDP projected +75% through 2027 vs. pandemic lows, but growth engine is spending and inflation, not productivity. 30-year yield at 5% marks inflection point.
- BofA's Hartnett flags U.S
- GDP growth as a nominal illusion: 75% expansion through 2027 driven by government spending and inflation, not productivity
- A 30-year Treasury yield above 5% could compress stock valuations and amplify federal debt costs
GDP to grow 75% through 2027 versus pandemic trough... yet growth engine is spending and inflation, not productivity
Bank of America Chief Investment Strategist Michael Hartnett has characterized the U.S. economy as locked in a 'nominal boom loop'—a framework explaining why the economy appears far stronger than underlying fundamentals suggest.
Hartnett projects U.S. GDP will grow approximately 75% through 2027 versus the 2020 pandemic trough. By headline numbers, this looks like robust expansion. The problem lies in the character of that growth.
Why the Economy Looks Bigger: Price Inflation and Spending Drive the Narrative
Nominal growth and real growth are fundamentally different. Nominal growth includes the inflation effect. When prices rise, selling the same goods generates higher nominal revenue.
Current U.S. economic expansion is not powered by factories running at higher capacity or improved labor productivity. Rather, government spending, price increases, and corporate revenues are all rising together in nominal dollar terms. Federal spending has increased over 60% since 2020, with another 15% expansion projected next year. This cash flowing through the economy supports jobs and inflates corporate top-line figures.
As a result, equities rise and corporations pay dividends, yet ordinary consumers feel their wallets tightening. Both can be true simultaneously because nominal growth does not necessarily improve real living standards.
30-Year Treasury Yield at 5%: The Number That Could End the Boom
Hartnett argues that market observers should monitor the bond market more closely than employment data.
The critical threshold is a 30-year U.S. Treasury yield at 5%. If rates hold near this level, the 'boom loop' continues spinning and supports risk assets. But a decisive break above 5% changes the equation. Corporate and household borrowing costs rise, equity valuations face compression, and the already-staggering $38.97 trillion federal debt burden (as of April 30, 2026) sees ballooning interest expenses.
A 30-year yield breach above 5% signals that the current boom transitions from a manageable tailwind into a systemic constraint across the entire financial system.
Wall Street GDP Forecasts: Clustered in the Low 2% Range
Major institutional 2026 U.S. GDP growth forecasts:
- Goldman Sachs: 2.5%
- JPMorgan: 2.0%
- Morgan Stanley: 2.2%
- CBO (Congressional Budget Office): 2.2%
- S&P Global Ratings: 2.2%
- Conference Board: 1.6%
Morgan Stanley notes that tax refund effects, first-quarter transitory factors, and eye-catching headline figures mask underlying headwinds from elevated oil prices, tariffs, and softening consumption. The message: scrutinize what lies behind impressive numbers.
Investors Keep Buying Regardless
Notably, capital continues flowing in amid this uncertainty. Equities attracted $23 billion in weekly inflows while bonds drew $19.9 billion—marking 53 consecutive weeks of bond inflows. The pattern reflects simultaneous positioning for growth and downside protection.


Wall Street's Defining Moments
See more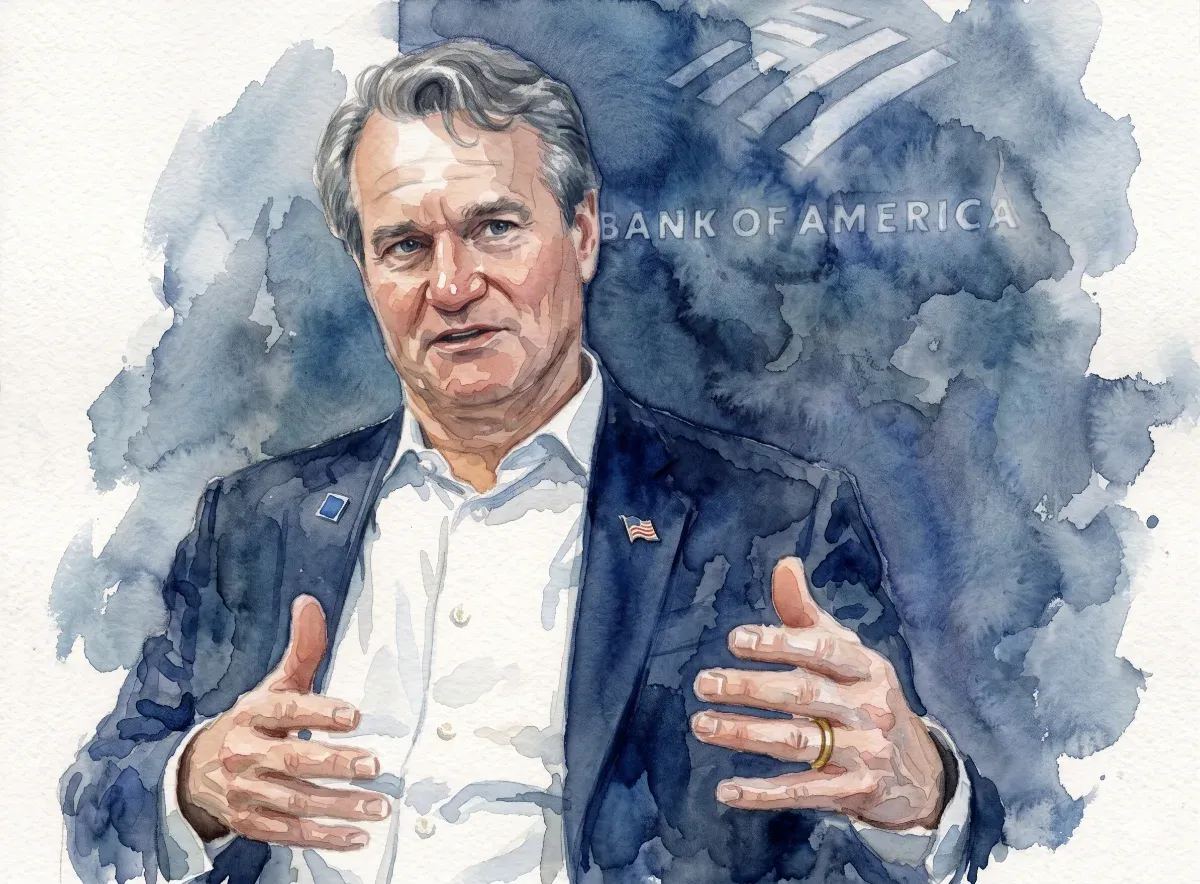


Smart Money Briefing
Weekly summaries of Wall Street guru moves and crypto whale activity.